
Alerts & notifications
An alert policy decides what counts as a failure and who hears about it. When a check breaks your policy's conditions, Canary9 fires a notification to your integrations and records it in the event log.
Create an alert policy
Open Alerts in the sidebar and select + New policy. A policy has a few parts:
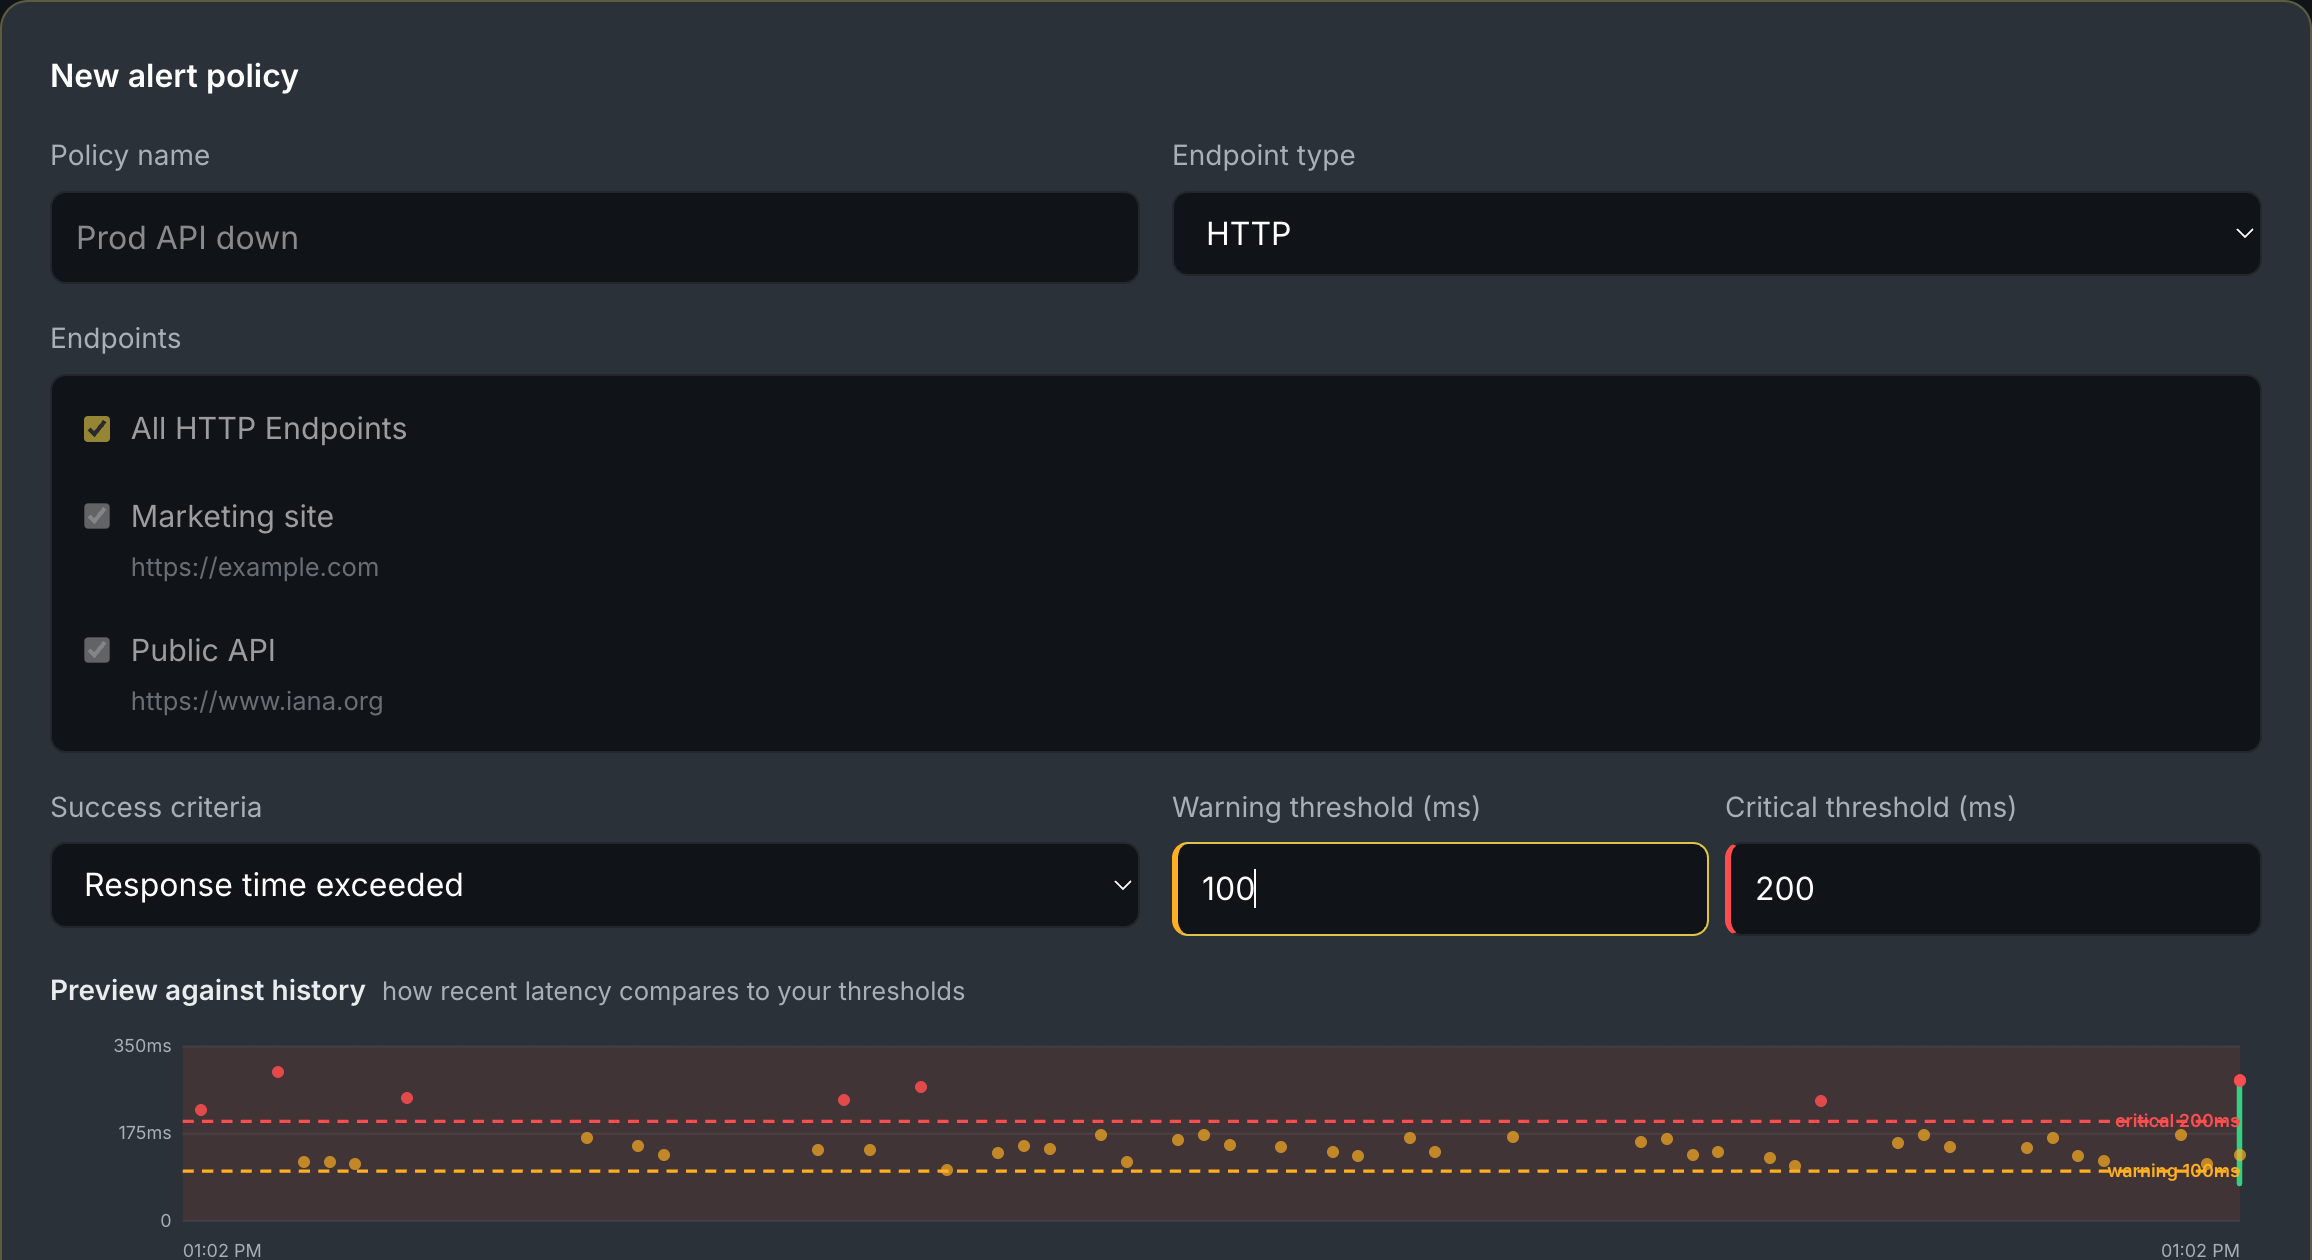
- Name: what you'll recognise the policy by (e.g. "Prod API down").
- Check type: which kind of endpoint the policy watches: HTTP, Ping, DNS, or TCP.
- Endpoints: apply it to all endpoints of that type, or pick specific ones.
- Condition: what makes a check "fail", with an optional warning level below the critical one for response-time and HTTP status (see below).
- Failure & recovery counts: how many consecutive failures trigger the alert (default 3) and how many consecutive successes clear it (default 2), so a single blip doesn't page you.
Conditions by check type
The available conditions depend on the check type:
HTTP
Expected status code (e.g. 200), a status range (e.g. 500–599), or a response-time threshold in milliseconds, each with an optional warning level.
Ping
Response-time threshold in milliseconds, with an optional warning level.
DNS
Alert when the name does not resolve.
TCP
Port closed, or a response-time threshold.
Templates: the Templates menu pre-fills common policies: "DNS does not resolve", "Web response time", "Web error status (400–599)", "Ping response time", "TCP port closed", so you can start from a sensible default and tweak.
Warning and critical levels
Response-time and HTTP status conditions support two levels, so Canary9 can nudge you before something is truly broken:
- Critical: the hard limit. Crossing it fires a down event (severity critical).
- Warning: an optional, lower bar. Crossing it (but not critical) fires a degraded event (severity warning), a heads-up rather than an outage.
The warning level is optional and only applies where "how bad" is a gradient:
- Response time: a warning threshold below the critical one (e.g. warn at 100 ms, alert at 200 ms).
- HTTP status range: a warning range alongside the critical range (e.g. warn on 400–499, alert on 500–599).
- Exact status code: your expected (ok) code, an optional warning code, and anything else is critical (e.g. expect 200, warn on 301).
Binary conditions have no warning level: DNS resolves or it doesn't, and a TCP port is open or closed. Both are ok or critical.
Preview against history
When you set a response-time policy, Canary9 charts the targeted endpoints' recent latency with your warning and critical thresholds drawn on top, and shows what share of recent checks would have crossed each line, so you can choose thresholds that fit reality instead of guessing. The dashed lines move as you type, and points that breach a threshold are coloured by the level they hit. (Rare outliers are left off so a single spike doesn't flatten the chart.)

Default policies
You don't start from a blank slate. Every organization ships with a set of default policies that watch all endpoints of their type from day one:
- DNS does not resolve: any DNS endpoint that stops resolving.
- Web response time: HTTP endpoints, warning at 100 ms and critical at 200 ms.
- Web error status (4xx/5xx): HTTP endpoints returning a 400–599 status.
- Ping response time: Ping endpoints, warning at 100 ms and critical at 200 ms.
- TCP port closed: TCP endpoints whose port stops accepting connections.
Default policies are managed, so they behave a little differently from your own:
- You can't delete them or change their conditions: they're always there as a safety net.
- You can mute one if it's too noisy for your setup.
- You can customise its notification message (see below): handy for adding a runbook link or routing it to a specific channel.
- You can copy one into a brand-new policy of your own, then edit every field: a fast way to start from a sensible baseline (e.g. copy "Web response time" and raise the critical threshold to 500 ms for one slower service).
Customizing notification messages
Every policy (default or your own) has an optional notification message. Leave it empty and Canary9 sends a sensible default to all of your enabled integrations. Fill it in to control the wording and where each kind of event goes.
A message is made of state blocks, one per situation. Write only the ones you care about:
{{ #critical }} … {{ #end_critical }}: when the check goes down.{{ #warning }} … {{ #end_warning }}: when it's degraded (slow but not down).{{ #critical_recovery }} … {{ #end_critical_recovery }}: when it recovers from down.{{ #warning_recovery }} … {{ #end_warning_recovery }}: when it recovers from degraded.{{ #no_data }} … {{ #end_no_data }}: when no results are coming in at all.
Inside any block, @-mention an integration's handle to route that situation there. No mention sends the block to every enabled integration. So you can page on-call for hard outages while keeping chatter in Slack:
{{ #critical }} API is down. Runbook: example.com/runbook  @pagerduty-oncall {{ #end_critical }}
{{ #warning }} API degraded  @slack-web {{ #end_warning }}
{{ #critical_recovery }} Recovered  @slack-web {{ #end_critical_recovery }}
In the editor, press Tab to autocomplete a block (type {{ #cr → Tab) or a handle
(type @slack- → Tab). Known handles are highlighted as you type, so a typo'd @mention is
easy to spot before you save.
Manage policies
- Mute: temporarily stop a policy from firing without deleting it (the bell icon on the row).
- Test: send a one-off test notification through the policy so you can confirm it reaches your integrations.
- Edit / Delete: change or remove a policy you created (default policies can't be deleted; copy or mute them instead).
The event log
The Event log tab is the timeline of everything that's happened: down, up, and degraded events, each with a severity (critical, warning, or info), the policy and endpoint involved, and when it occurred. Filter by policy to focus on one service.