
Monitoring endpoints
An endpoint is anything you want Canary9 to watch: a website, an API, a database port, or a DNS record. This guide walks through creating one and choosing the right check type.
Create an endpoint
From the dashboard, open Endpoints in the sidebar and select + Add endpoint. You'll see the new-endpoint form:
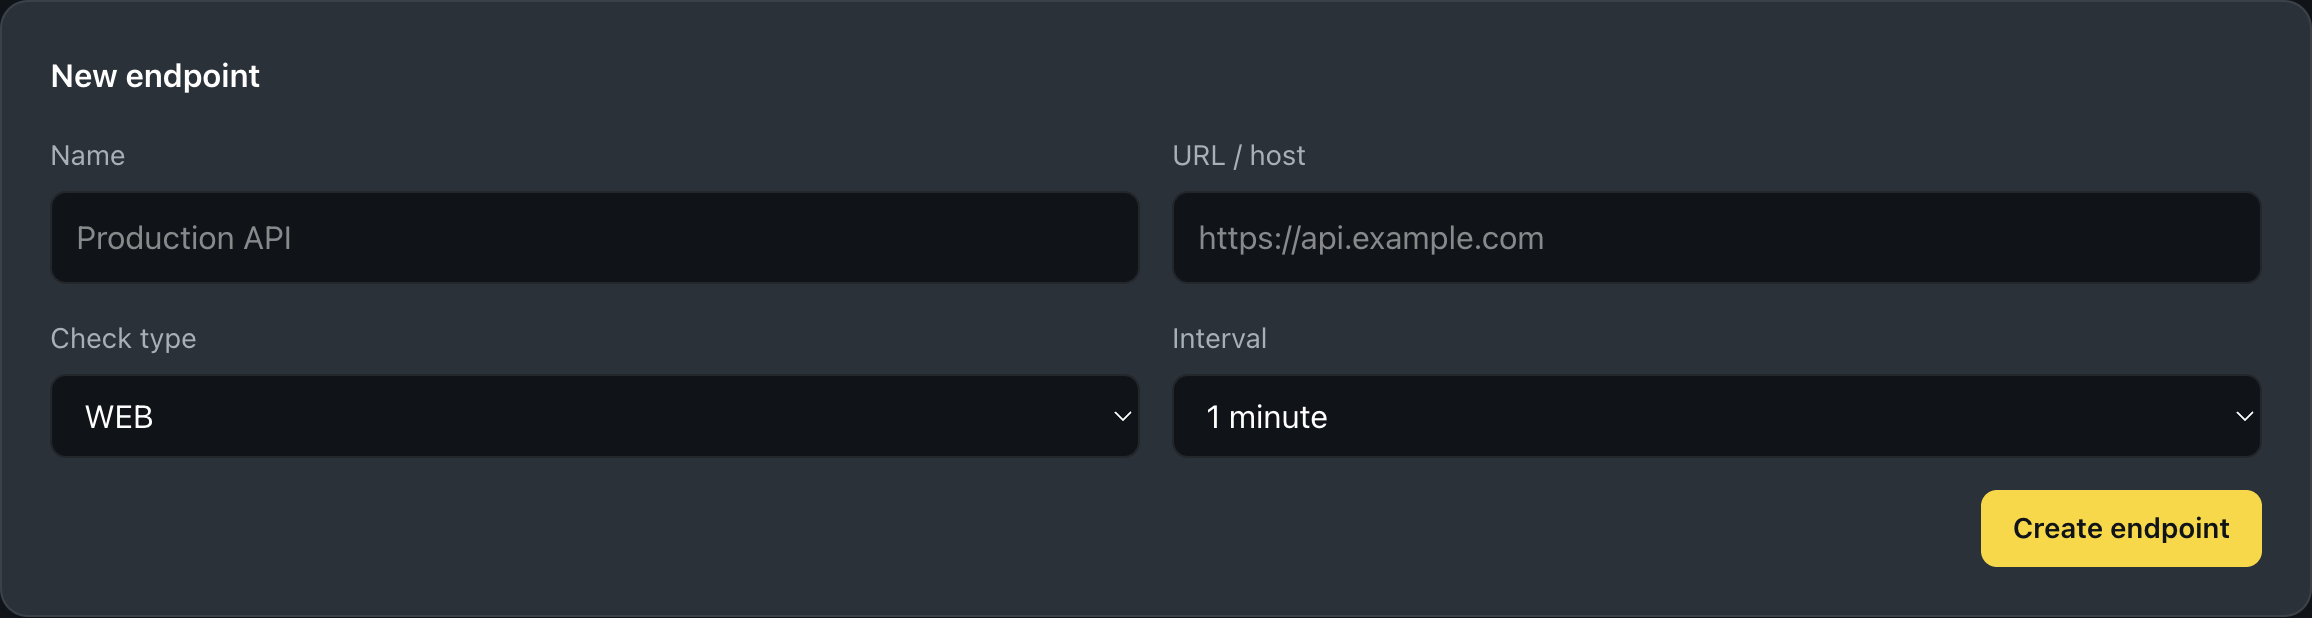
Fill in the fields:
- Name: a label you'll recognise in the dashboard and alerts (e.g. "Marketing site" or "Checkout API").
- URL / host: what to check. For web checks, the full URL (
https://api.example.com); for TCP, the host (a port field appears); for ping and DNS, the hostname. - Check type: how Canary9 probes the target. See check types below.
- Interval: how often the check runs, from 1 minute upward.
Select Save and the endpoint begins reporting on its next interval. Within a few minutes you'll have uptime history and a response-time graph.
Tip: start with a 1-minute HTTP check on your most important page, then add TCP, DNS, or browser checks for deeper coverage.
Monitoring locations
Canary9 runs its checks from probe nodes in multiple AWS regions, so you can watch your service from where your users actually are, and catch regional problems a single vantage point would miss. The Check from field on the create and edit forms lets you choose the location(s) each check runs from.
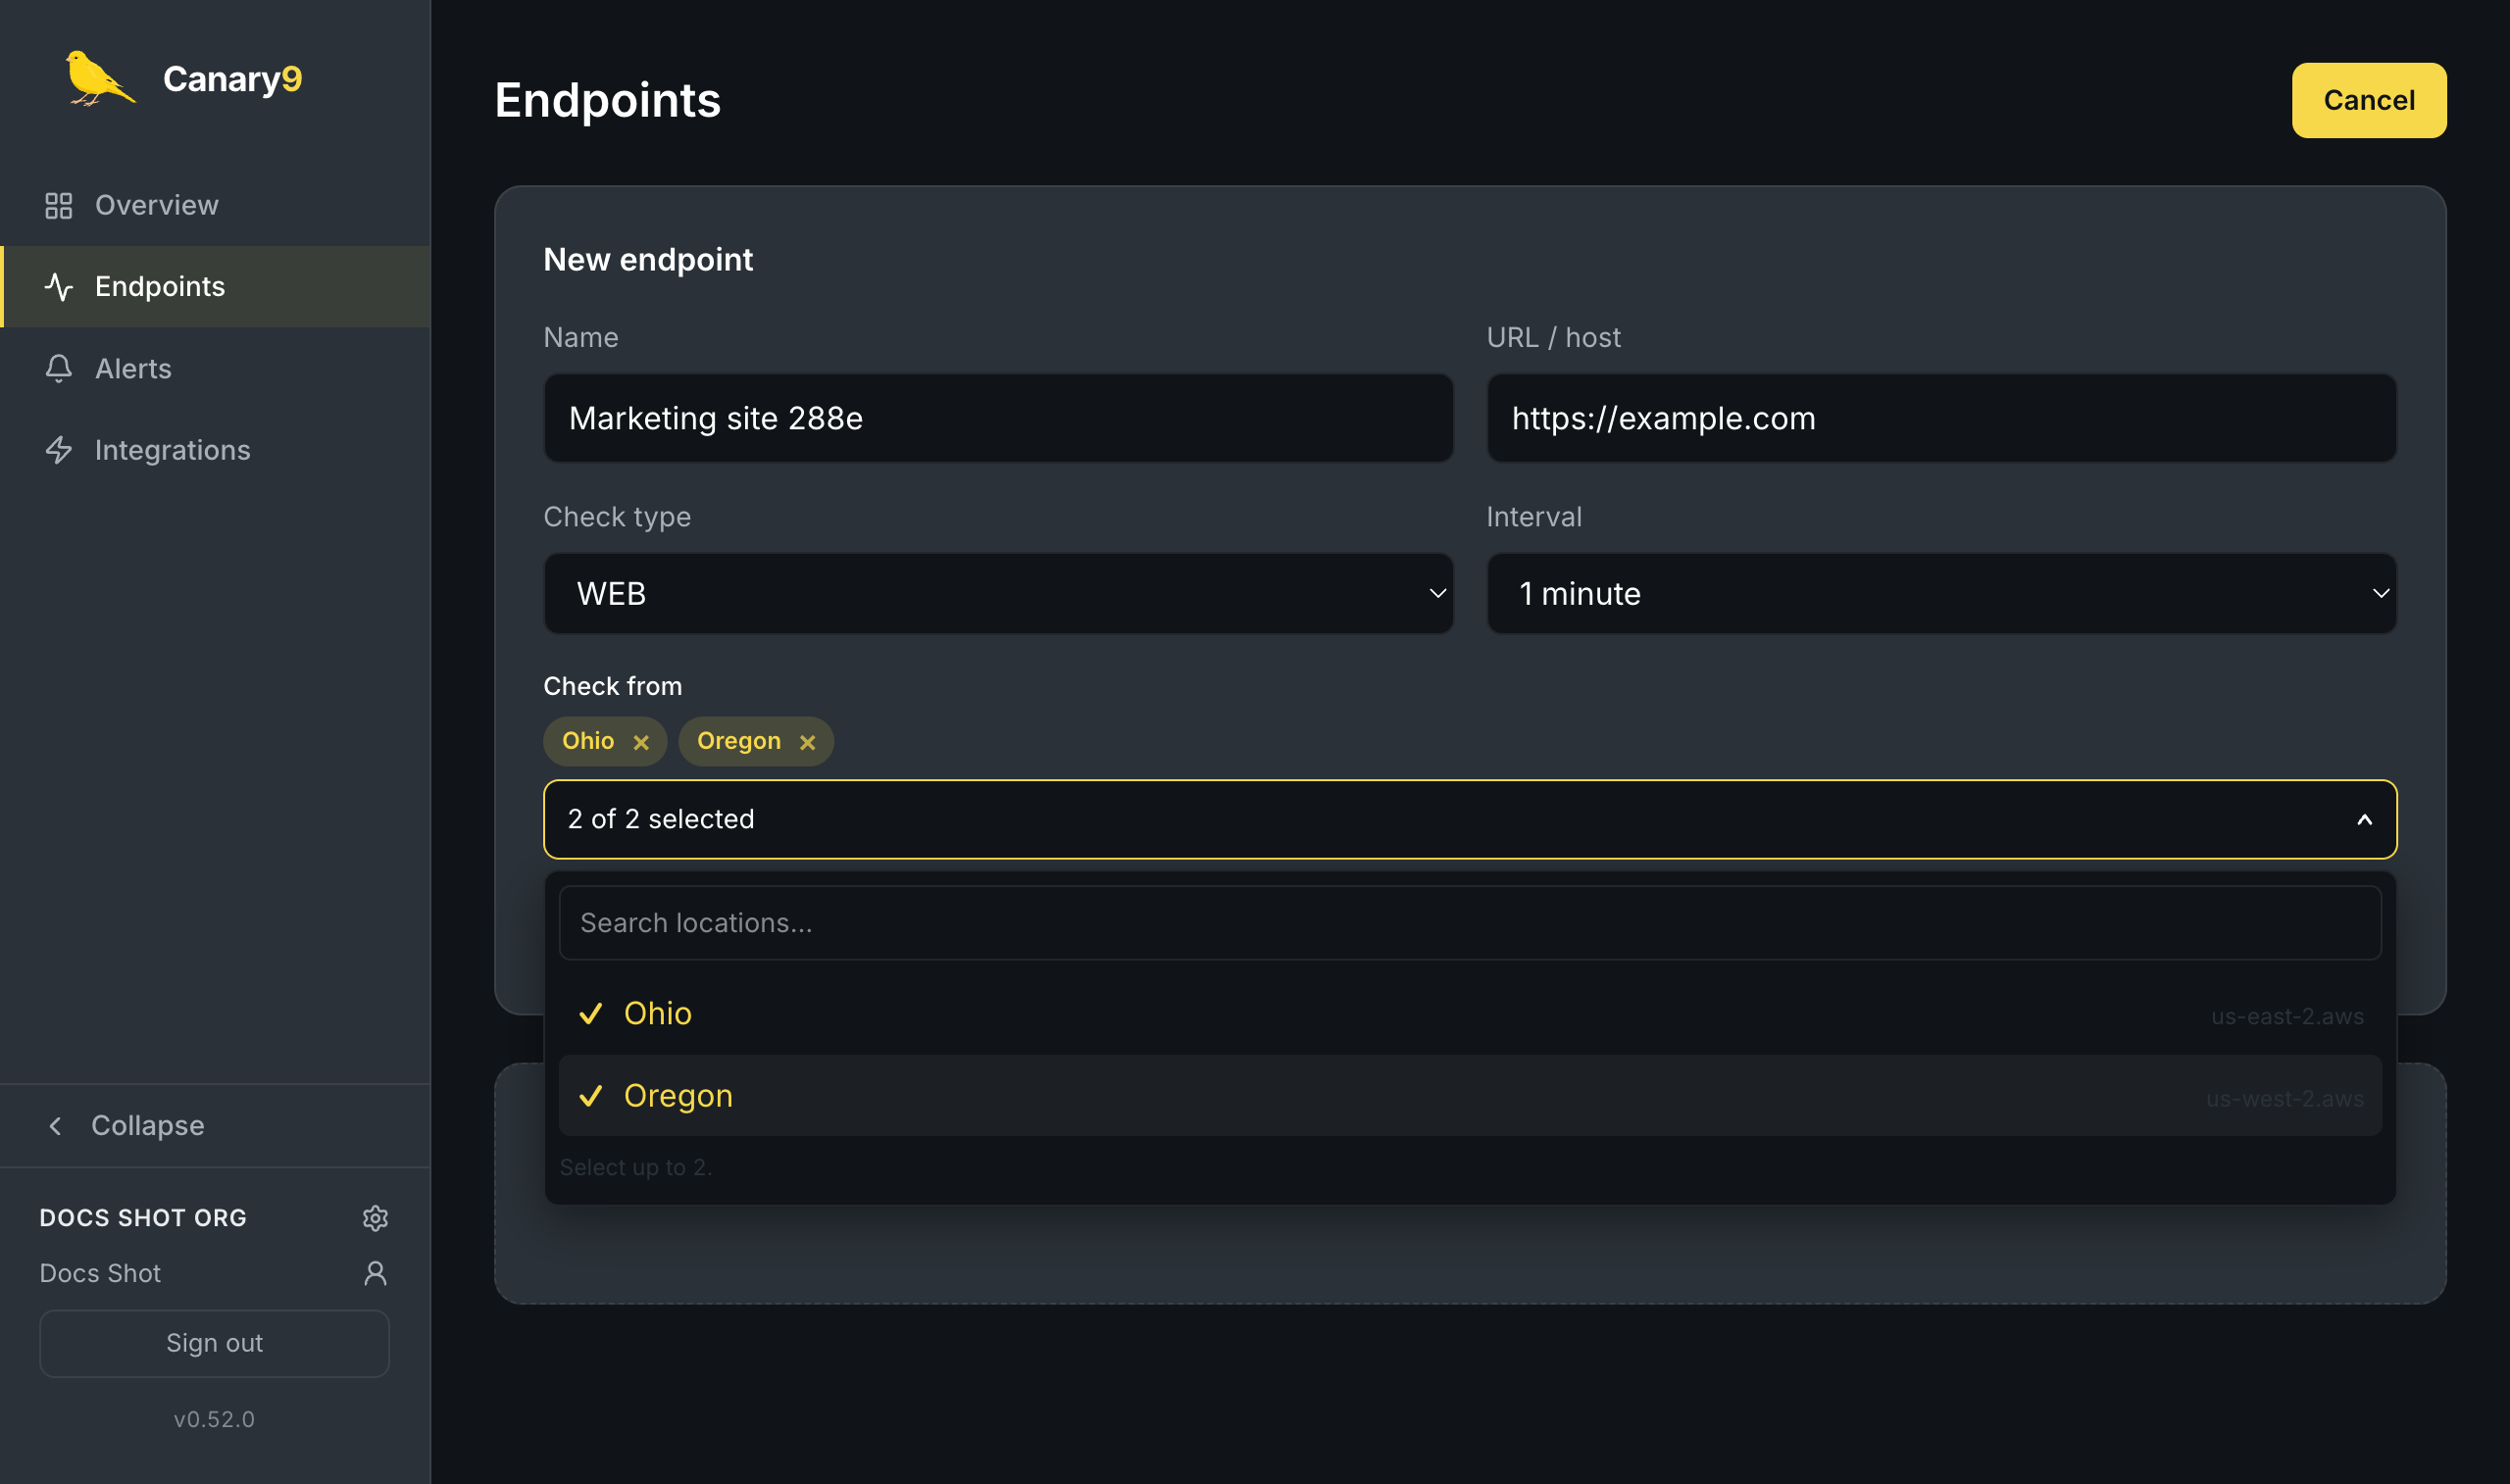
- Pick up to two locations per endpoint. The picker is searchable: start typing to filter the list.
- Sensible default: if you don't pick one, Canary9 assigns a location automatically, so every endpoint is covered from the moment you save it.
- Check from more than one place: select two and Canary9 runs the check from each, giving you a second opinion before you trust a single region's view.
- Change it anytime from the edit form. Your history is preserved.
Each endpoint shows its locations as a badge in the list, so you can always see where a check runs from at a glance:
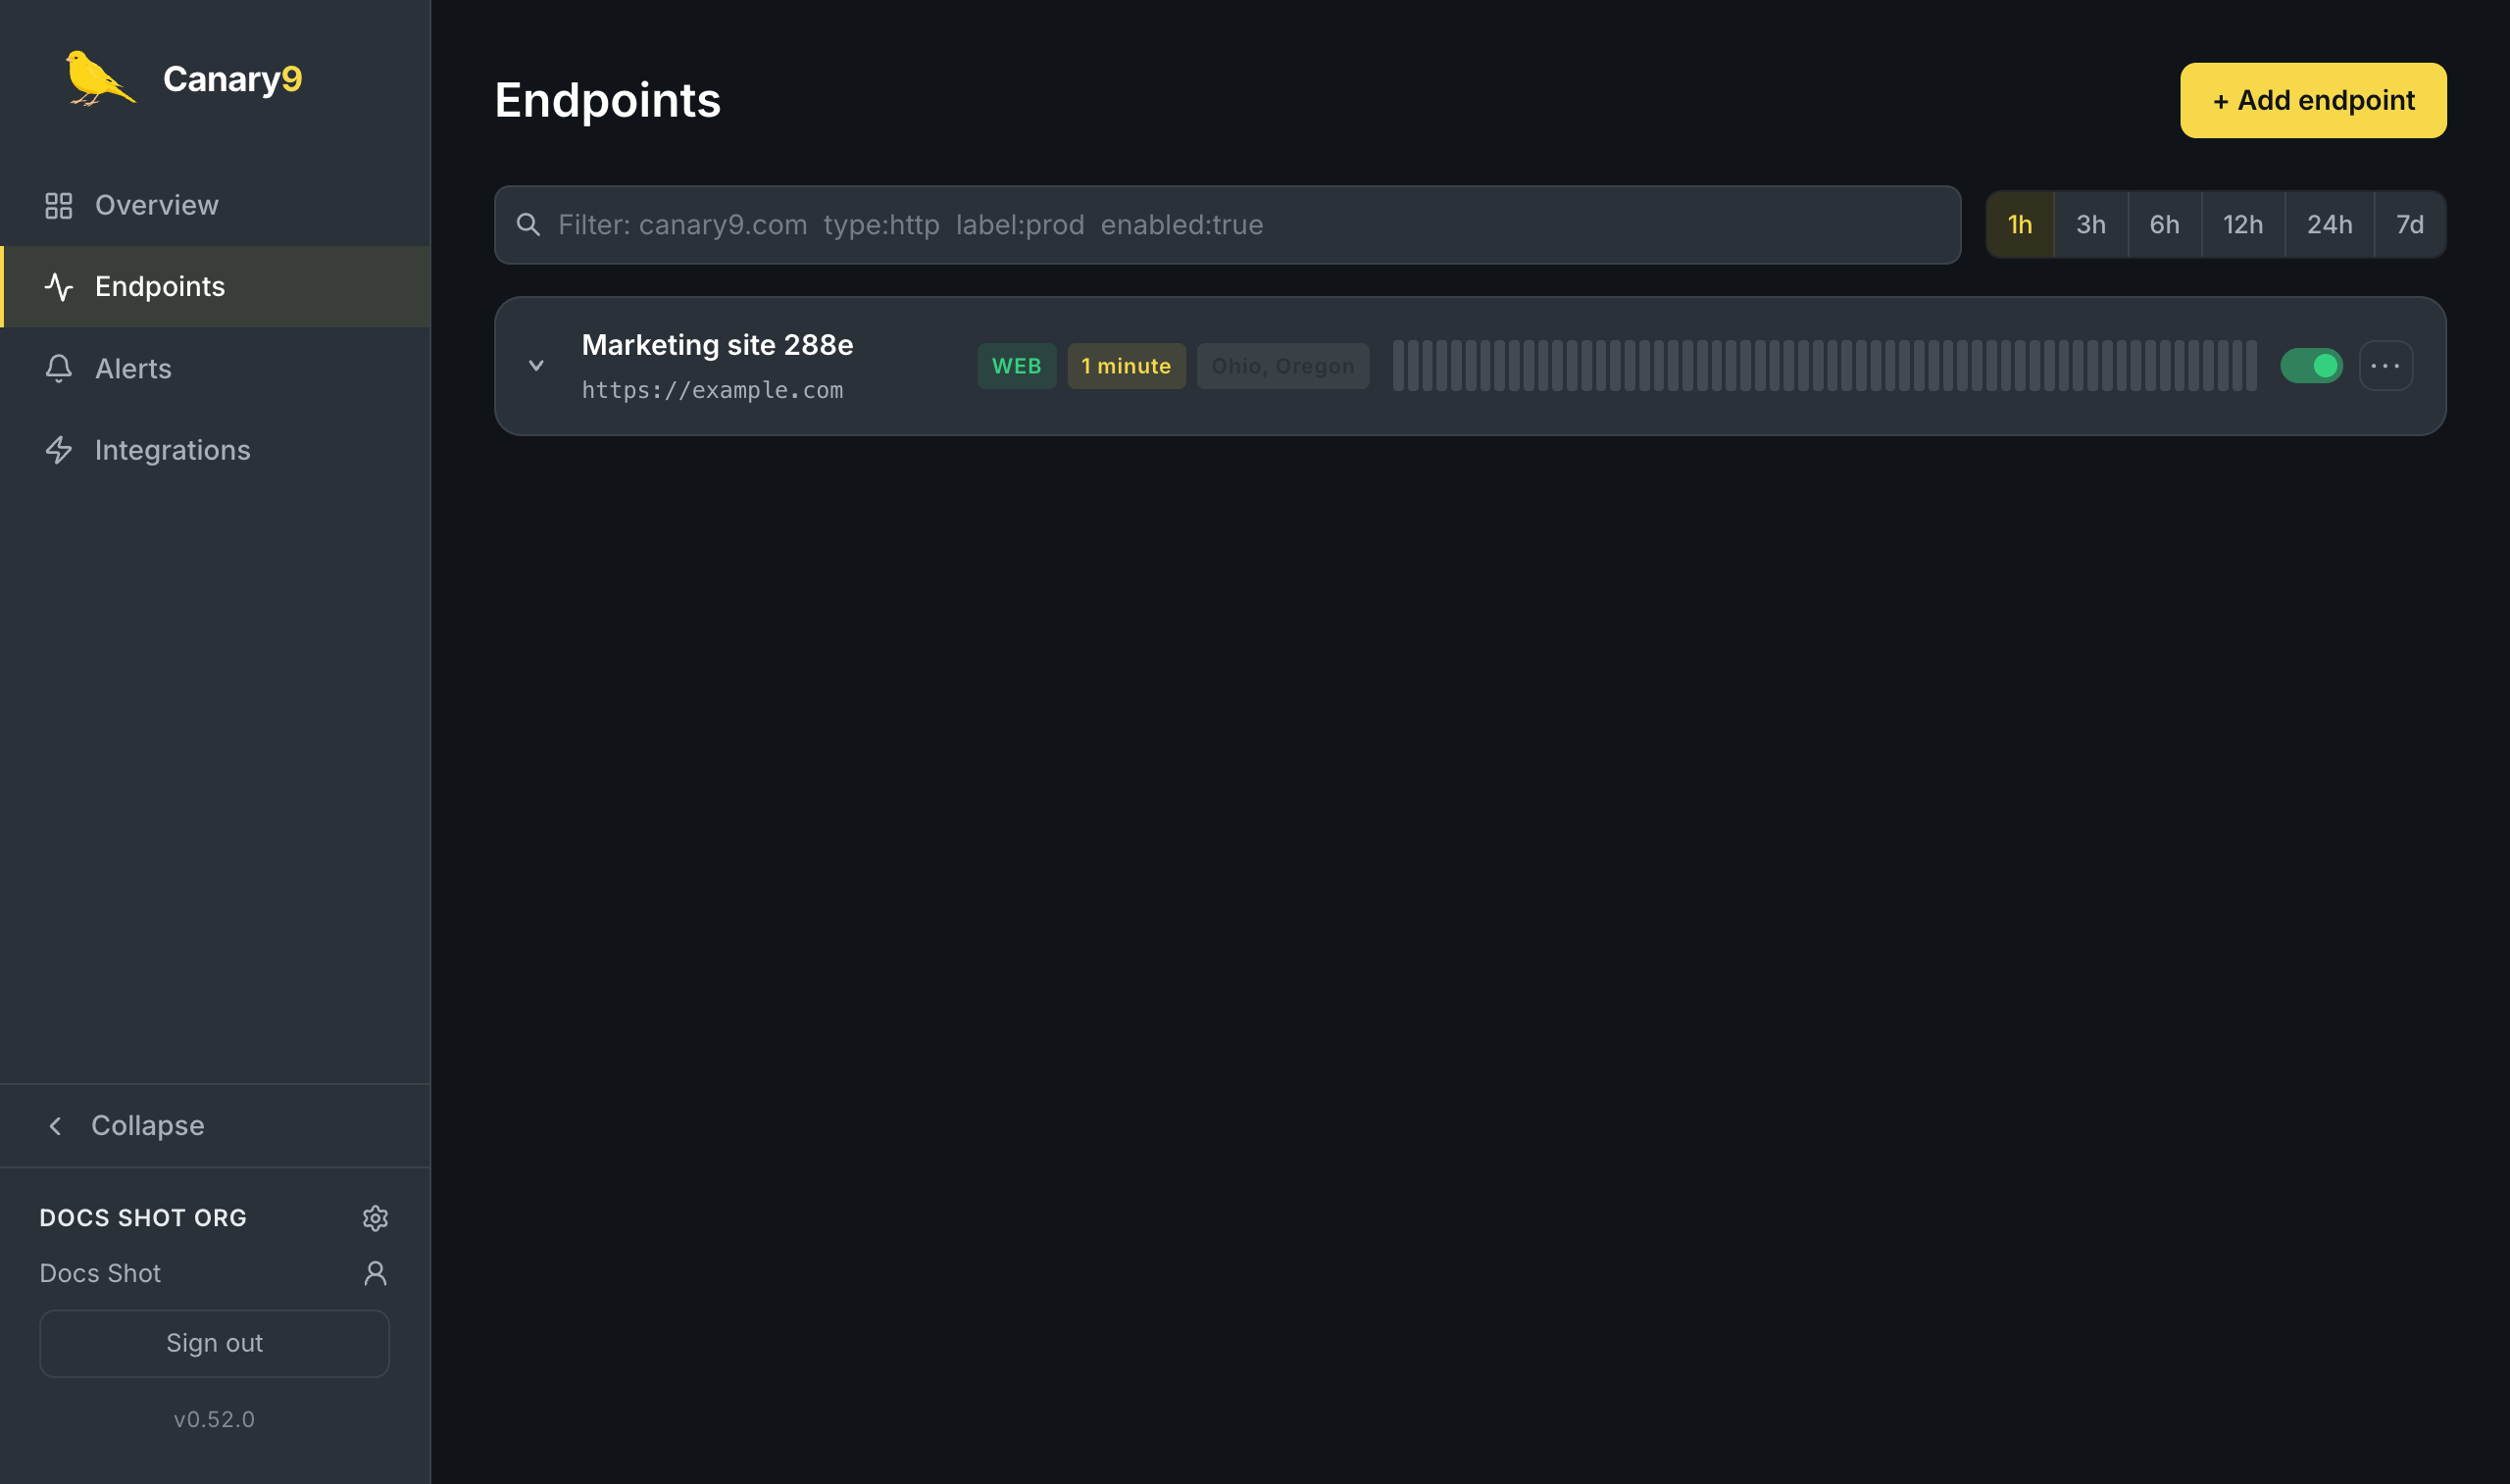
More locations are on the way. We're continuously expanding our probe network. New regions show up in the picker automatically as they come online.
Comparing locations on the chart
When an endpoint checks from more than one location, its response-time chart overlays one line per location on a shared time axis and scale, so a real difference between regions reads as real separation on the chart, not an artifact of two separate y-axes.
- A small legend below the chart names each location (in color) and shows its own average latency, p95 latency, and uptime, so you can tell at a glance which location is slower or less reliable.
- Uptime, downtime gaps, and pause markers stay whole-endpoint. They describe the endpoint as a whole (a gap means no location reported), so they're shown once, not duplicated per location.
- Single-location endpoints are unaffected: the chart renders exactly as a single line, with no legend, until you add a second location.
Track status at a glance
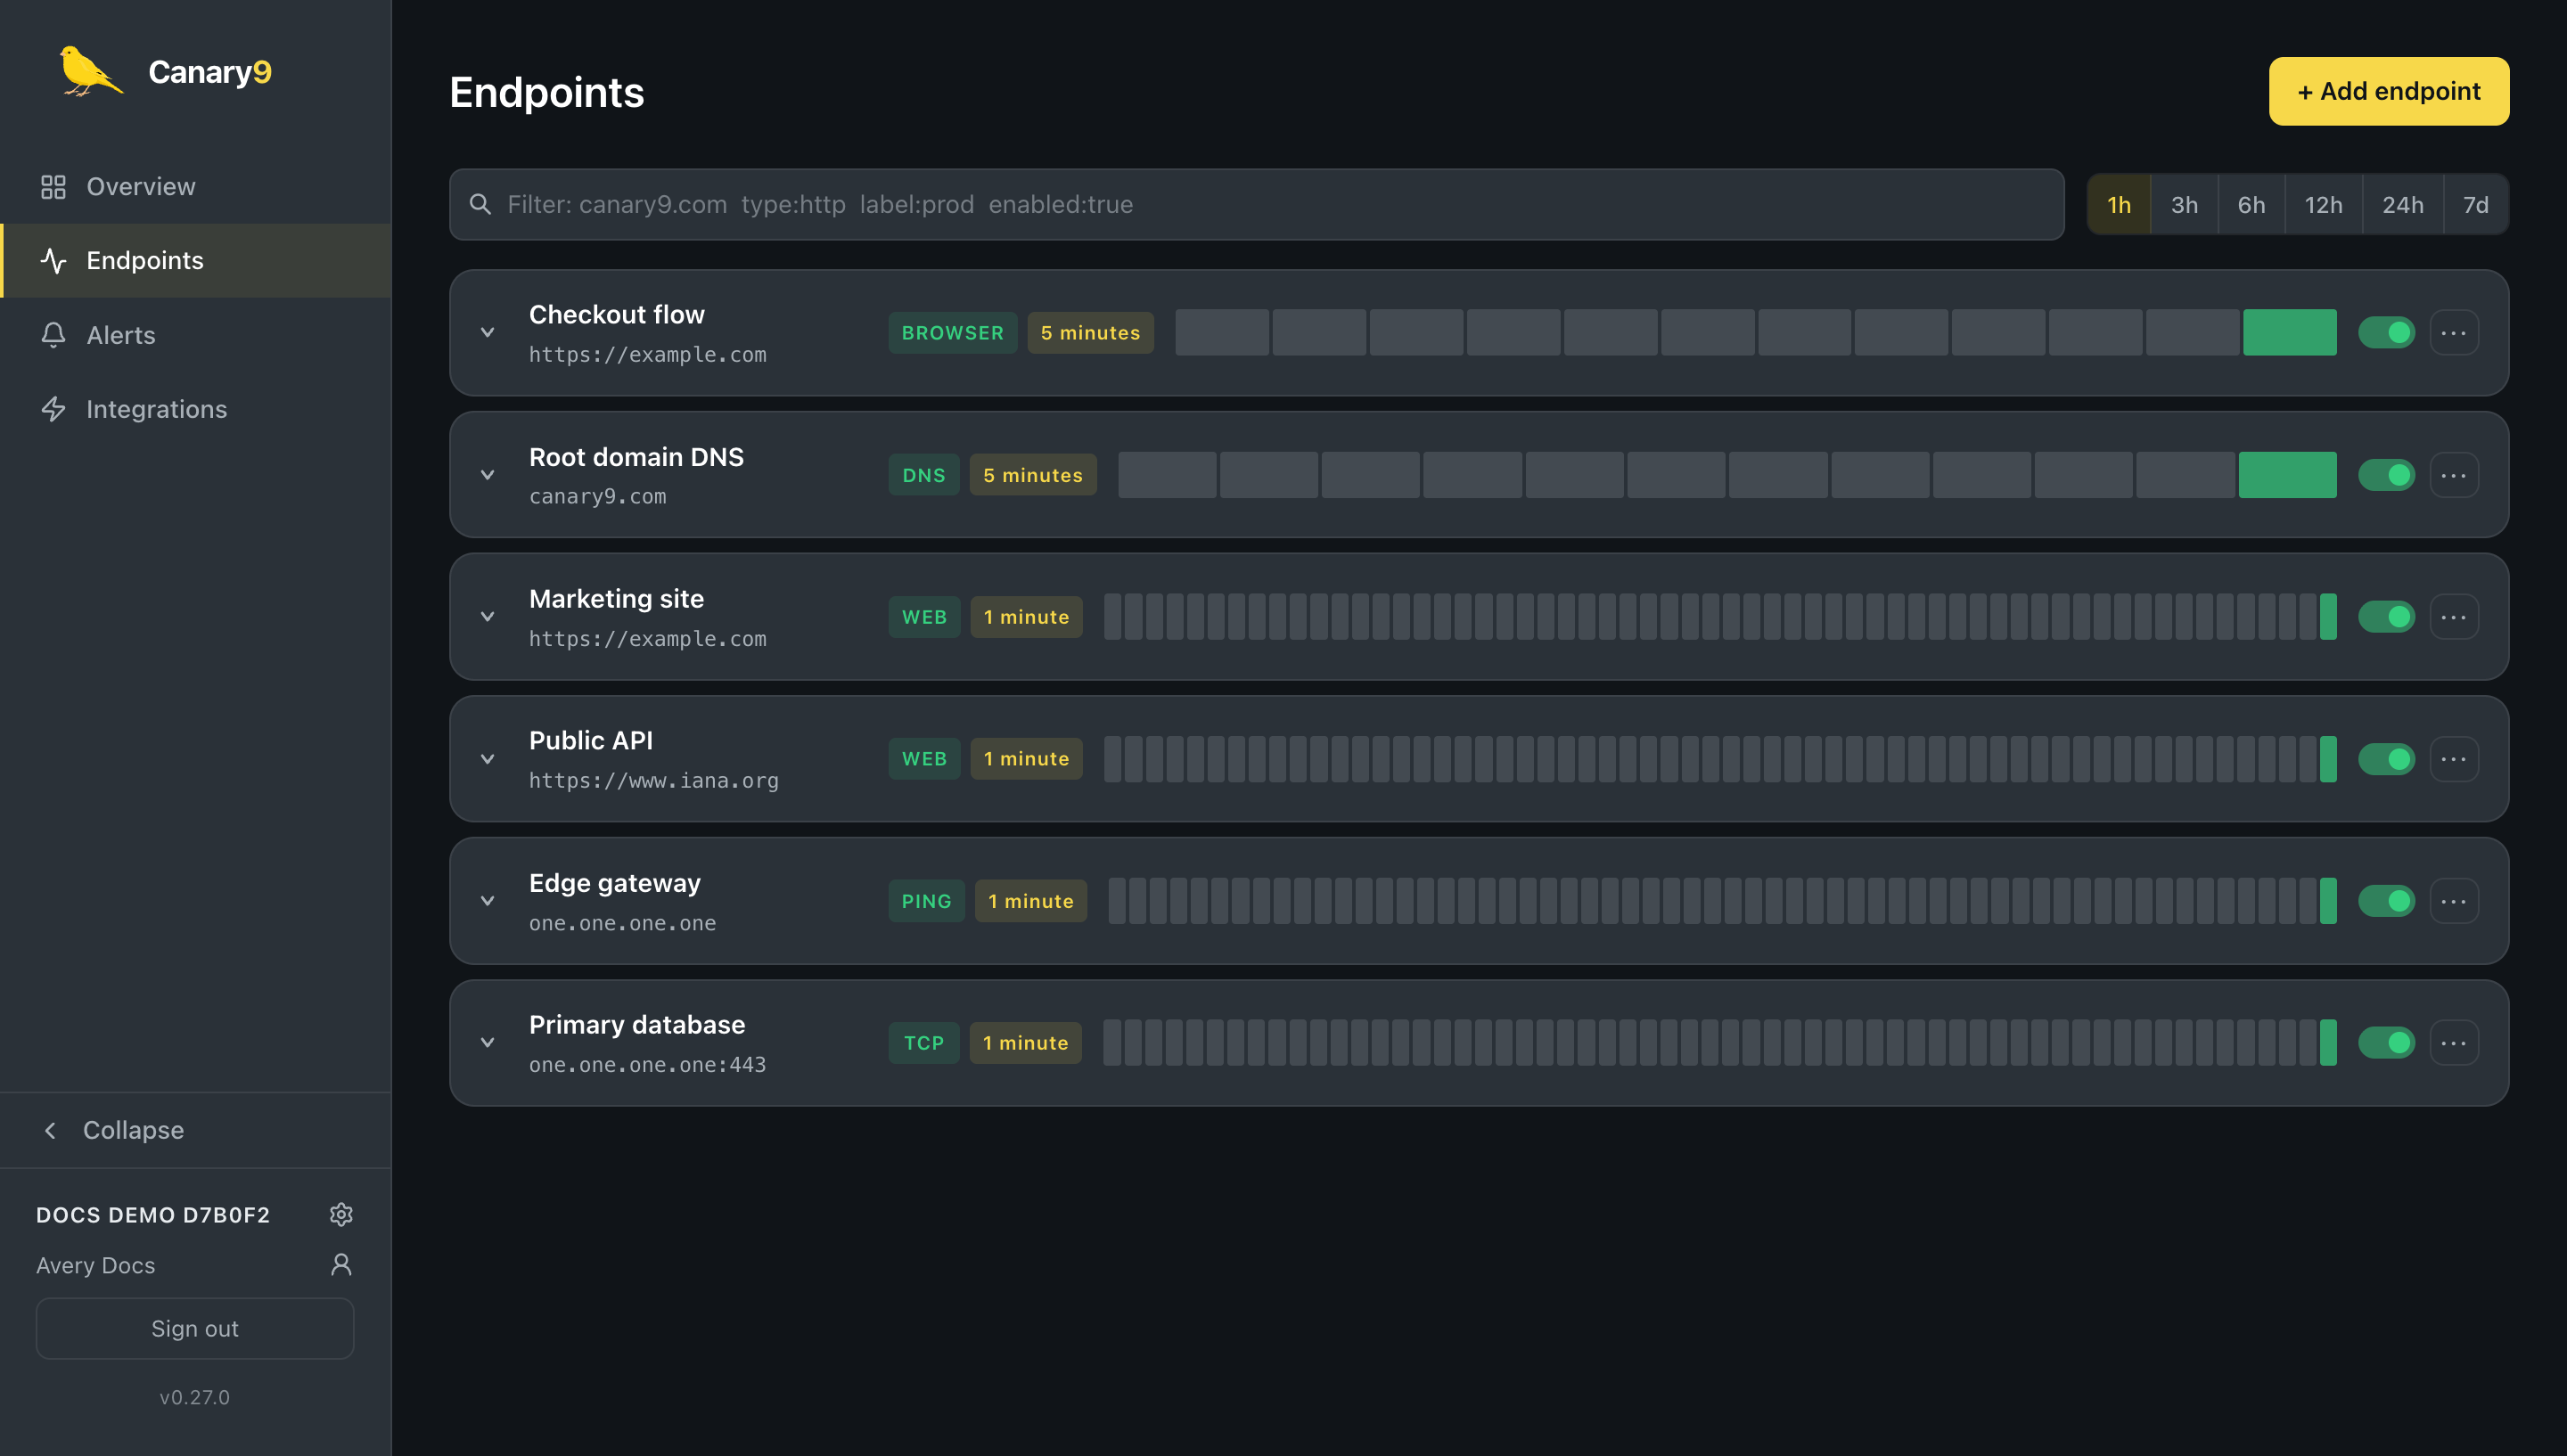
The Endpoints page lists everything you monitor with its current state, latest response time, and uptime. Select any row to open its detail view with response-time graphs and recent check history.
Check types
Canary9 supports five check types. Pick the one that matches what you need to verify:
HTTP / HTTPS
Requests a URL and verifies it responds successfully and quickly. Tracks status code, response time, and (optionally) response body content. The default for websites and APIs.
TCP port
Opens a TCP connection to a host and port to confirm a service is accepting connections: databases, mail servers, custom backends.
Ping (ICMP)
Sends ICMP echo requests to confirm a host is reachable and measures round-trip latency. Good for servers and network gear.
DNS
Resolves a hostname and checks the records returned (A, AAAA, CNAME, MX, and more) so you catch DNS outages and misconfigurations.
Browser
Loads the page in a real headless browser, capturing a screenshot and full render. Catches problems a simple HTTP check can't see.
HTTP vs. browser checks
An HTTP check is fast and lightweight: it confirms your server answered. A browser check actually renders the page in Chromium, so it catches broken JavaScript, failed asset loads, and visual regressions, and stores a screenshot you can review from the endpoint's detail view.
Verify response content (HTTP checks)
A status code alone doesn't always tell the whole story: a page can return 200 OK while showing an error page, a maintenance banner, or a stale cached response. HTTP checks can optionally assert on the response body as well as the status code, from the create or edit form's Content check field:
- Keyword: the response body must contain (or must not contain) an exact piece of text, e.g.
"status: ok". - Regex: match a PCRE-style regular expression instead of literal text, e.g.
version:\s*\d+. Patterns are evaluated with Python'sreengine, which supports the familiar PCRE syntax (character classes, groups, alternation, anchors, lookarounds). - Invert the match: tick "Fail if body matches" to flip the rule around, so the check fails when the pattern is found. Handy for catching a maintenance-mode banner or an error string that should never appear.
When a content check fails, whether from the wrong status code or a content mismatch, Canary9 captures a short excerpt of the response body and shows it alongside the error in the endpoint's detail view, so you can see exactly what came back without needing to reproduce the failure yourself.
The Overview dashboard
Overview is your at-a-glance home: every endpoint with its current state (up or paused), target, check type, and interval. Select any monitor to jump straight to its detail view on the Endpoints page.
Find & organize endpoints
As you add more endpoints, a few tools keep the list manageable:
- Filter: the search box matches names and targets, and supports filters:
type:http,label:prod, andenabled:true/enabled:false. Combine them, e.g.type:http label:prod. - Labels: tag endpoints (with a colour) from the edit form to group them by team, environment, or service, then filter by label.
- Time range: switch the whole list between 1h, 3h, 6h, 12h, 24h, and 7d to widen or narrow the history shown.
- Pause / resume: the toggle on each row stops or restarts checks without deleting the endpoint.
- Edit / delete: the
⋯menu opens an inline editor (name, target, type, interval, labels) or deletes the endpoint after a confirmation.
Reading the data
Each row shows a status history strip: one bar per time bucket, green for healthy, amber for slow or 4xx, red for errors, grey for no data. Expand a row for the full detail view:
- Response-time chart: latency over the selected window, with uptime %, average, and p95 headline stats. Downtime gaps are shaded so you can see exactly when things broke. Endpoints checked from more than one location show one overlaid line per location with a legend; see Comparing locations on the chart.
- HTTP checks show a latest failure panel when the most recent check is down, with the error message and, when a content check is configured, a captured excerpt of the response body.
- Uptime stat: the share of checks that succeeded over the currently selected time range. See Uptime % and SLA reporting below.
- DNS checks show what the name currently resolves to plus a short history of record changes.
- Browser checks show the latest screenshot of the rendered page alongside the load-time chart.
Uptime % and SLA reporting
Every endpoint detail view has an Uptime stat that follows the page's time-range selector, so the percentage always describes the same window as the charts and status bars around it. It's a straightforward measure: the share of checks that succeeded in the selected window.
- A brand-new endpoint never shows an alarming number. Right after you create an endpoint there's no data yet, so Canary9 shows "Collecting data…" until at least one full check interval has passed, rather than a misleading 0% or 100% from a single sample. Time before the endpoint existed is never counted against it, even on a wide window like 7d. The status bars and chart make the same distinction: time from before the endpoint existed is grey, a gap where checks should have run but nothing was recorded is highlighted in red, and time the monitor was deliberately paused shows in amber. The chart also draws vertical marker lines at the moment an endpoint was created, paused, or resumed, so you can line events up with the latency data around them.
- "No data" is shown honestly. If enough time has passed but no checks landed for a window (the monitor was paused, for example), the stat reads "No data" instead of guessing at a percentage.
For customers who need to report against a contractual SLA target (e.g. 99.9%), the API also exposes a monthly uptime-vs-target report per endpoint, with a CSV export for sharing with stakeholders. Reach out at sales@canary9.com if you'd like this surfaced in the dashboard for your plan.
These reports measure your endpoints. For what Canary9 commits to for its own platform, including the five-nines target, outage definitions, and reimbursement, see Service commitments.